Desktop views
Structure
Section titled “Structure”A scene consists of a main .fxml file located in src/views/ and a corresponding controller class located in org.blockchainbench.desktop.controller. The FXML file can be opened and configured in SceneBuilder; it defines the layout of the scene. The controller defines the handlers for the buttons and the dynamic rendering of the items located on the scene. Additionally, a scene can open multiple dialogs.
Controllers and views
Section titled “Controllers and views”There are three main views:
| View | Controller | Purpose |
|---|---|---|
config.fxml | ConfigController | Lets the user edit configurations and start a simulation based on them, or import results to jump to the results view immediately. |
simulation.fxml | SimulationController | Shows the live progress of a running group and routes to the results view on completion. |
result.fxml | ResultsController | Presents the collected results of a finished group. |
They are complemented by dialogs and detail windows:
| View | Controller | Opened from |
|---|---|---|
simulation_config_dialog.fxml | SimulationConfigDialogController | Configuration: Add / Edit a single row |
model_editor.fxml | ModelEditorController | Configuration: New… / Edit… next to the blockchain model |
run_details.fxml | RunDetailsController | Results: Show Details |
pareto_view.fxml | ParetoViewController | Run details: the Pareto analysis panel |
error_dialog.fxml | ErrorDialogController | Every scene, whenever an error occurs |
Scene navigation
Section titled “Scene navigation”SceneManager handles the navigation between scenes by loading the next scene with the given data. It keeps the primary Stage and exposes one method per screen: showConfig, showSimulation, showResults, and so on.
stateDiagram-v2
  direction LR

  [*] --> Config
  Config --> Sim : run simulation
  Config --> Results : import results
  Sim --> Results : sim finished
  Sim --> Config : cancelled
  Results --> Config : new simulation
Configuration
Section titled “Configuration”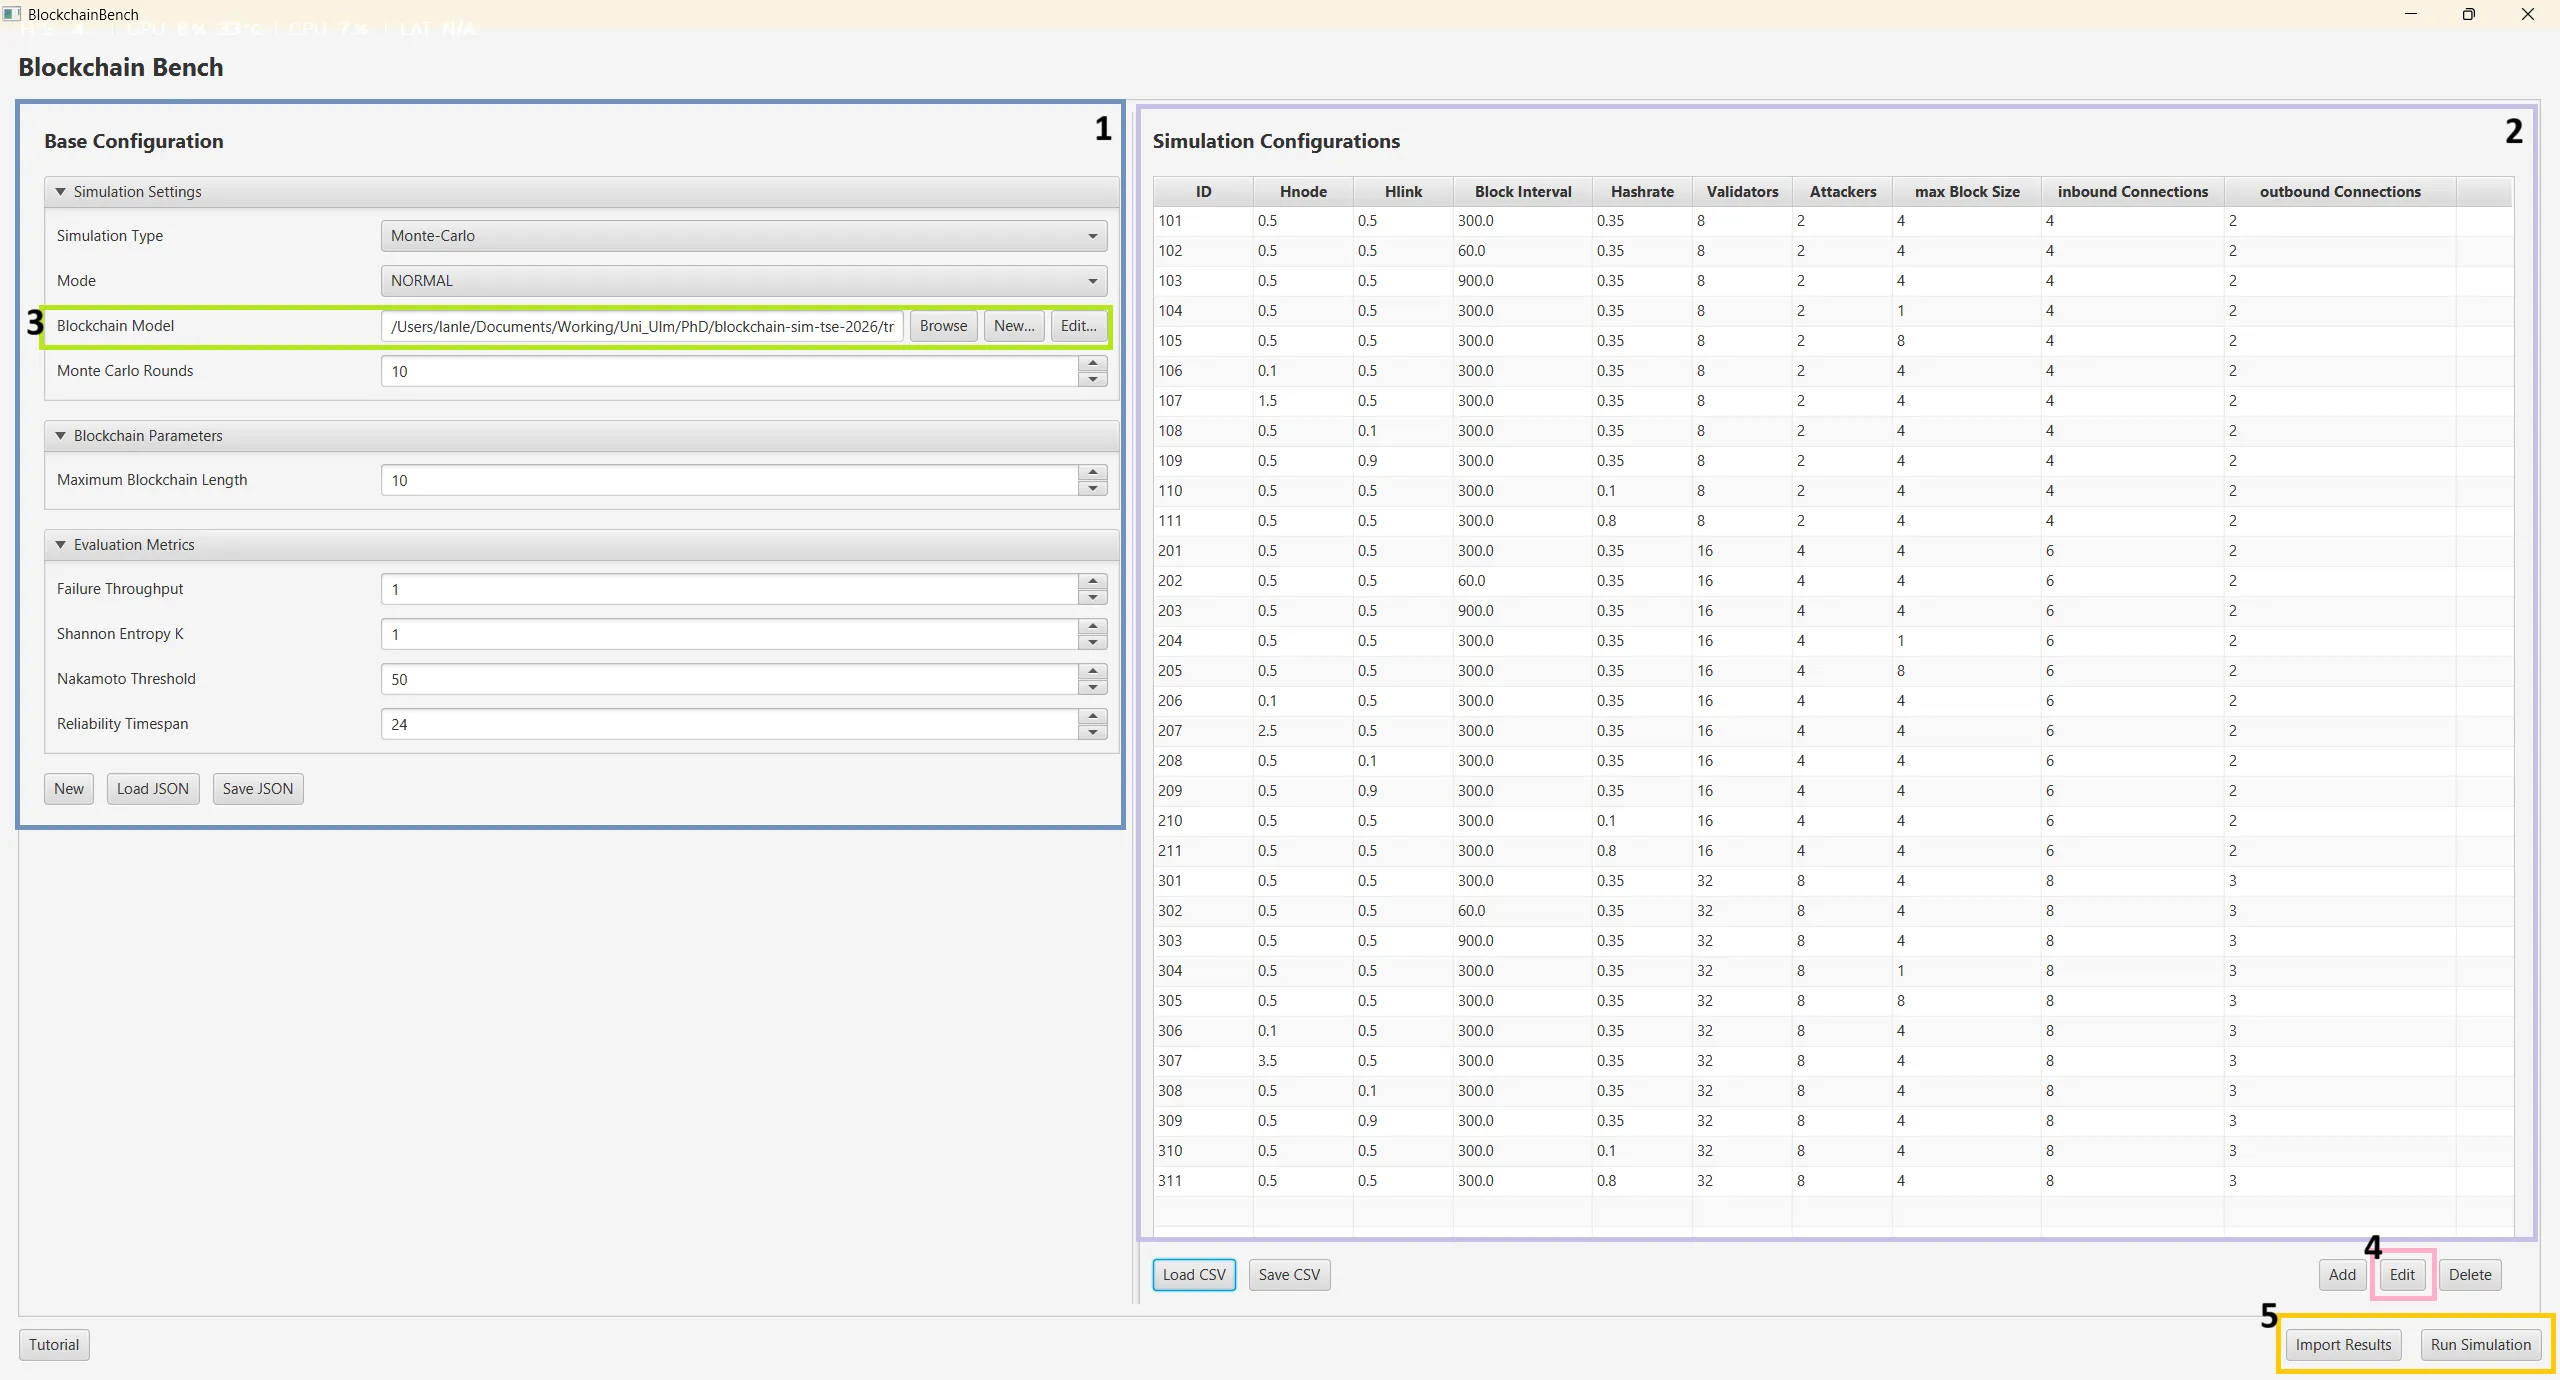
- General configuration — the
BaseConfigshared by all runs of the group: simulation type (Monte-Carlo or single), mode (NORMALorATTACK), the blockchain model, the number of Monte-Carlo rounds, the maximum blockchain length, and the four evaluation thresholds. New, Load JSON and Save JSON manage the base configuration as a file. - Simulation configurations — one
SimulationConfigper row, loaded from and saved to CSV. Each row becomes one run. - Blockchain model — the path to the model the runs are simulated against. Browse picks an existing model, New… and Edit… open the model editor.
- Edit opens a dialog that allows editing a single row; Add and Delete manage rows.
- Import Results lets the user choose a
.jsonresult file and opens the results view directly. Run Simulation starts a simulation with the configured configurations.
The Tutorial button in the bottom-left corner starts a guided walkthrough of the view; the same button exists on the results view, the run details and the edit dialog.
Navigation within the configuration view
Section titled “Navigation within the configuration view”stateDiagram-v2
direction LR
bmd: opens model_editor.fxml
sd : opens simulation_config_dialog.fxml
[*] --> Configuration
state Configuration{
direction TB
[*] --> editing
editing --> BlockchainModel : 3. New / Edit
editing --> Simulation : 4. Edit
editing --> editing : edit values
Simulation --> editing : close / save
BlockchainModel --> editing : close / save
state BlockchainModel{
bmd
}
state Simulation{
sd
}
}
editing --> Simulating : Run Simulation
Configuration --> Results : Import Results
state Simulating {
Running
Running : Simulation is running
}
Simulating --> Results
state Results {
ShowResults
ShowResults : Show results
}
Blockchain model editor
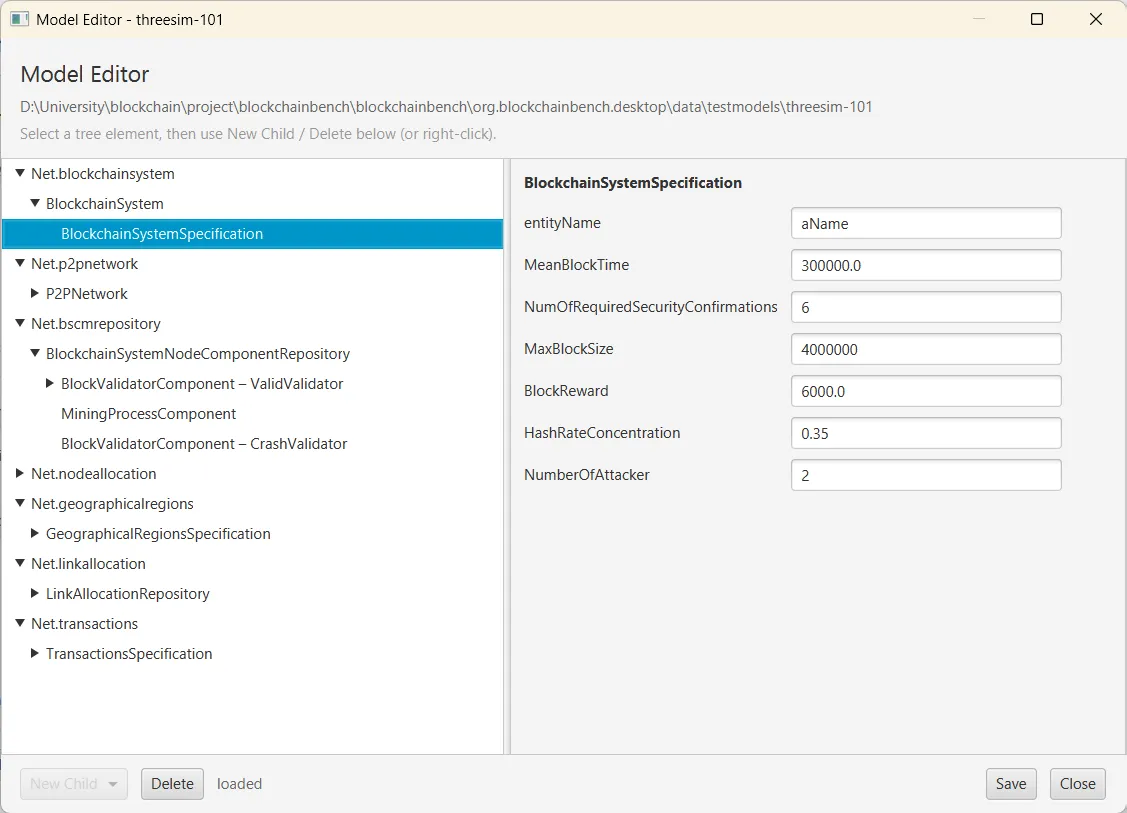
Section titled “Blockchain model editor”The model editor walks the blockchain system model as a tree — the BlockchainSystem, the P2P network, the node component repository, node allocation, geographical regions, link allocation and transactions — and edits the selected element’s properties in place. New Child and Delete change the tree, Save writes the model back to its folder.
Simulation configuration dialog
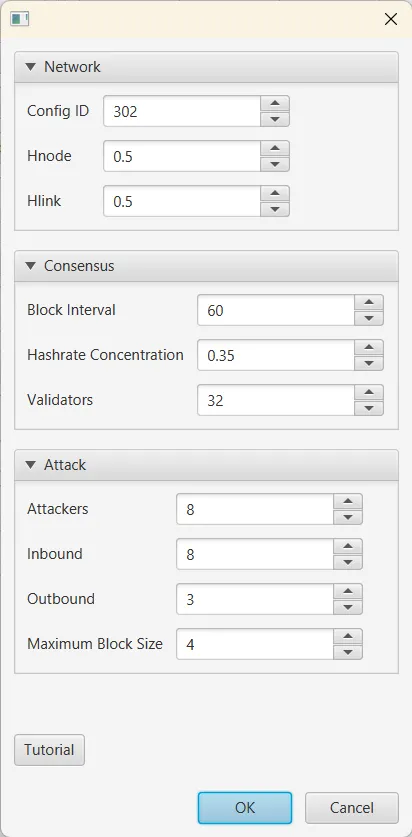
Section titled “Simulation configuration dialog”The dialog edits one row of the simulation configuration table, grouped into network (config id, Hnode, Hlink), consensus (block interval, hashrate concentration, validators) and attack (attackers, inbound and outbound connections, maximum block size) parameters.
Simulation
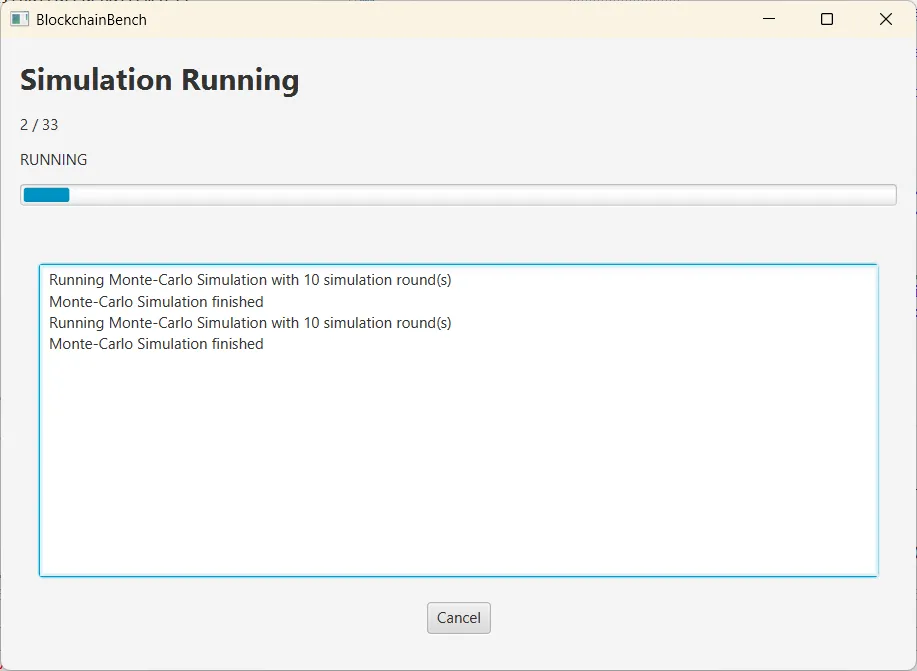
Section titled “Simulation”This view shows the progress of the current runs: the run counter, the group status, a progress bar and the live console output of the simulator. Cancel lets the current run finish, marks the remaining queued runs as cancelled and then opens the results view for the runs that did complete.
Results
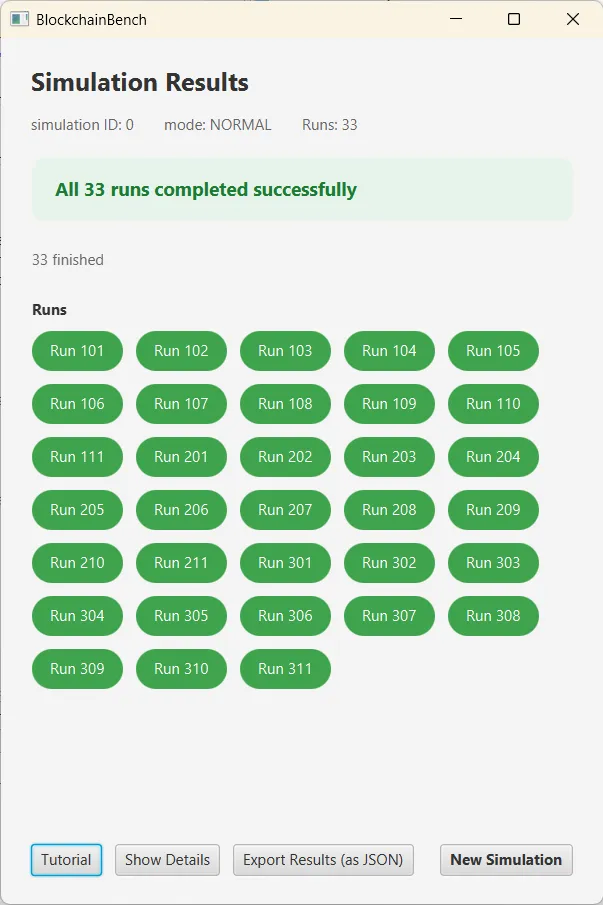
Section titled “Results”The results view lists the runs of the finished group. Green runs completed successfully, grey runs were cancelled and red runs failed; a banner at the top summarises the outcome, and clicking a failed run shows the reason. Show Details opens the run details, Export Results (as JSON) writes the group to disk, and New Simulation returns to the configuration view.
Run details
Section titled “Run details”Show Details opens run_details.fxml, which displays a detailed view of the run results: a header with simulation time and memory, a run selector with the filter sidebar, the tabs (Overview, General results, Base config, Input parameters, Attack, Averages, Rounds), a chart of the selected metric across all runs of the group, and the Pareto analysis cube on the right.
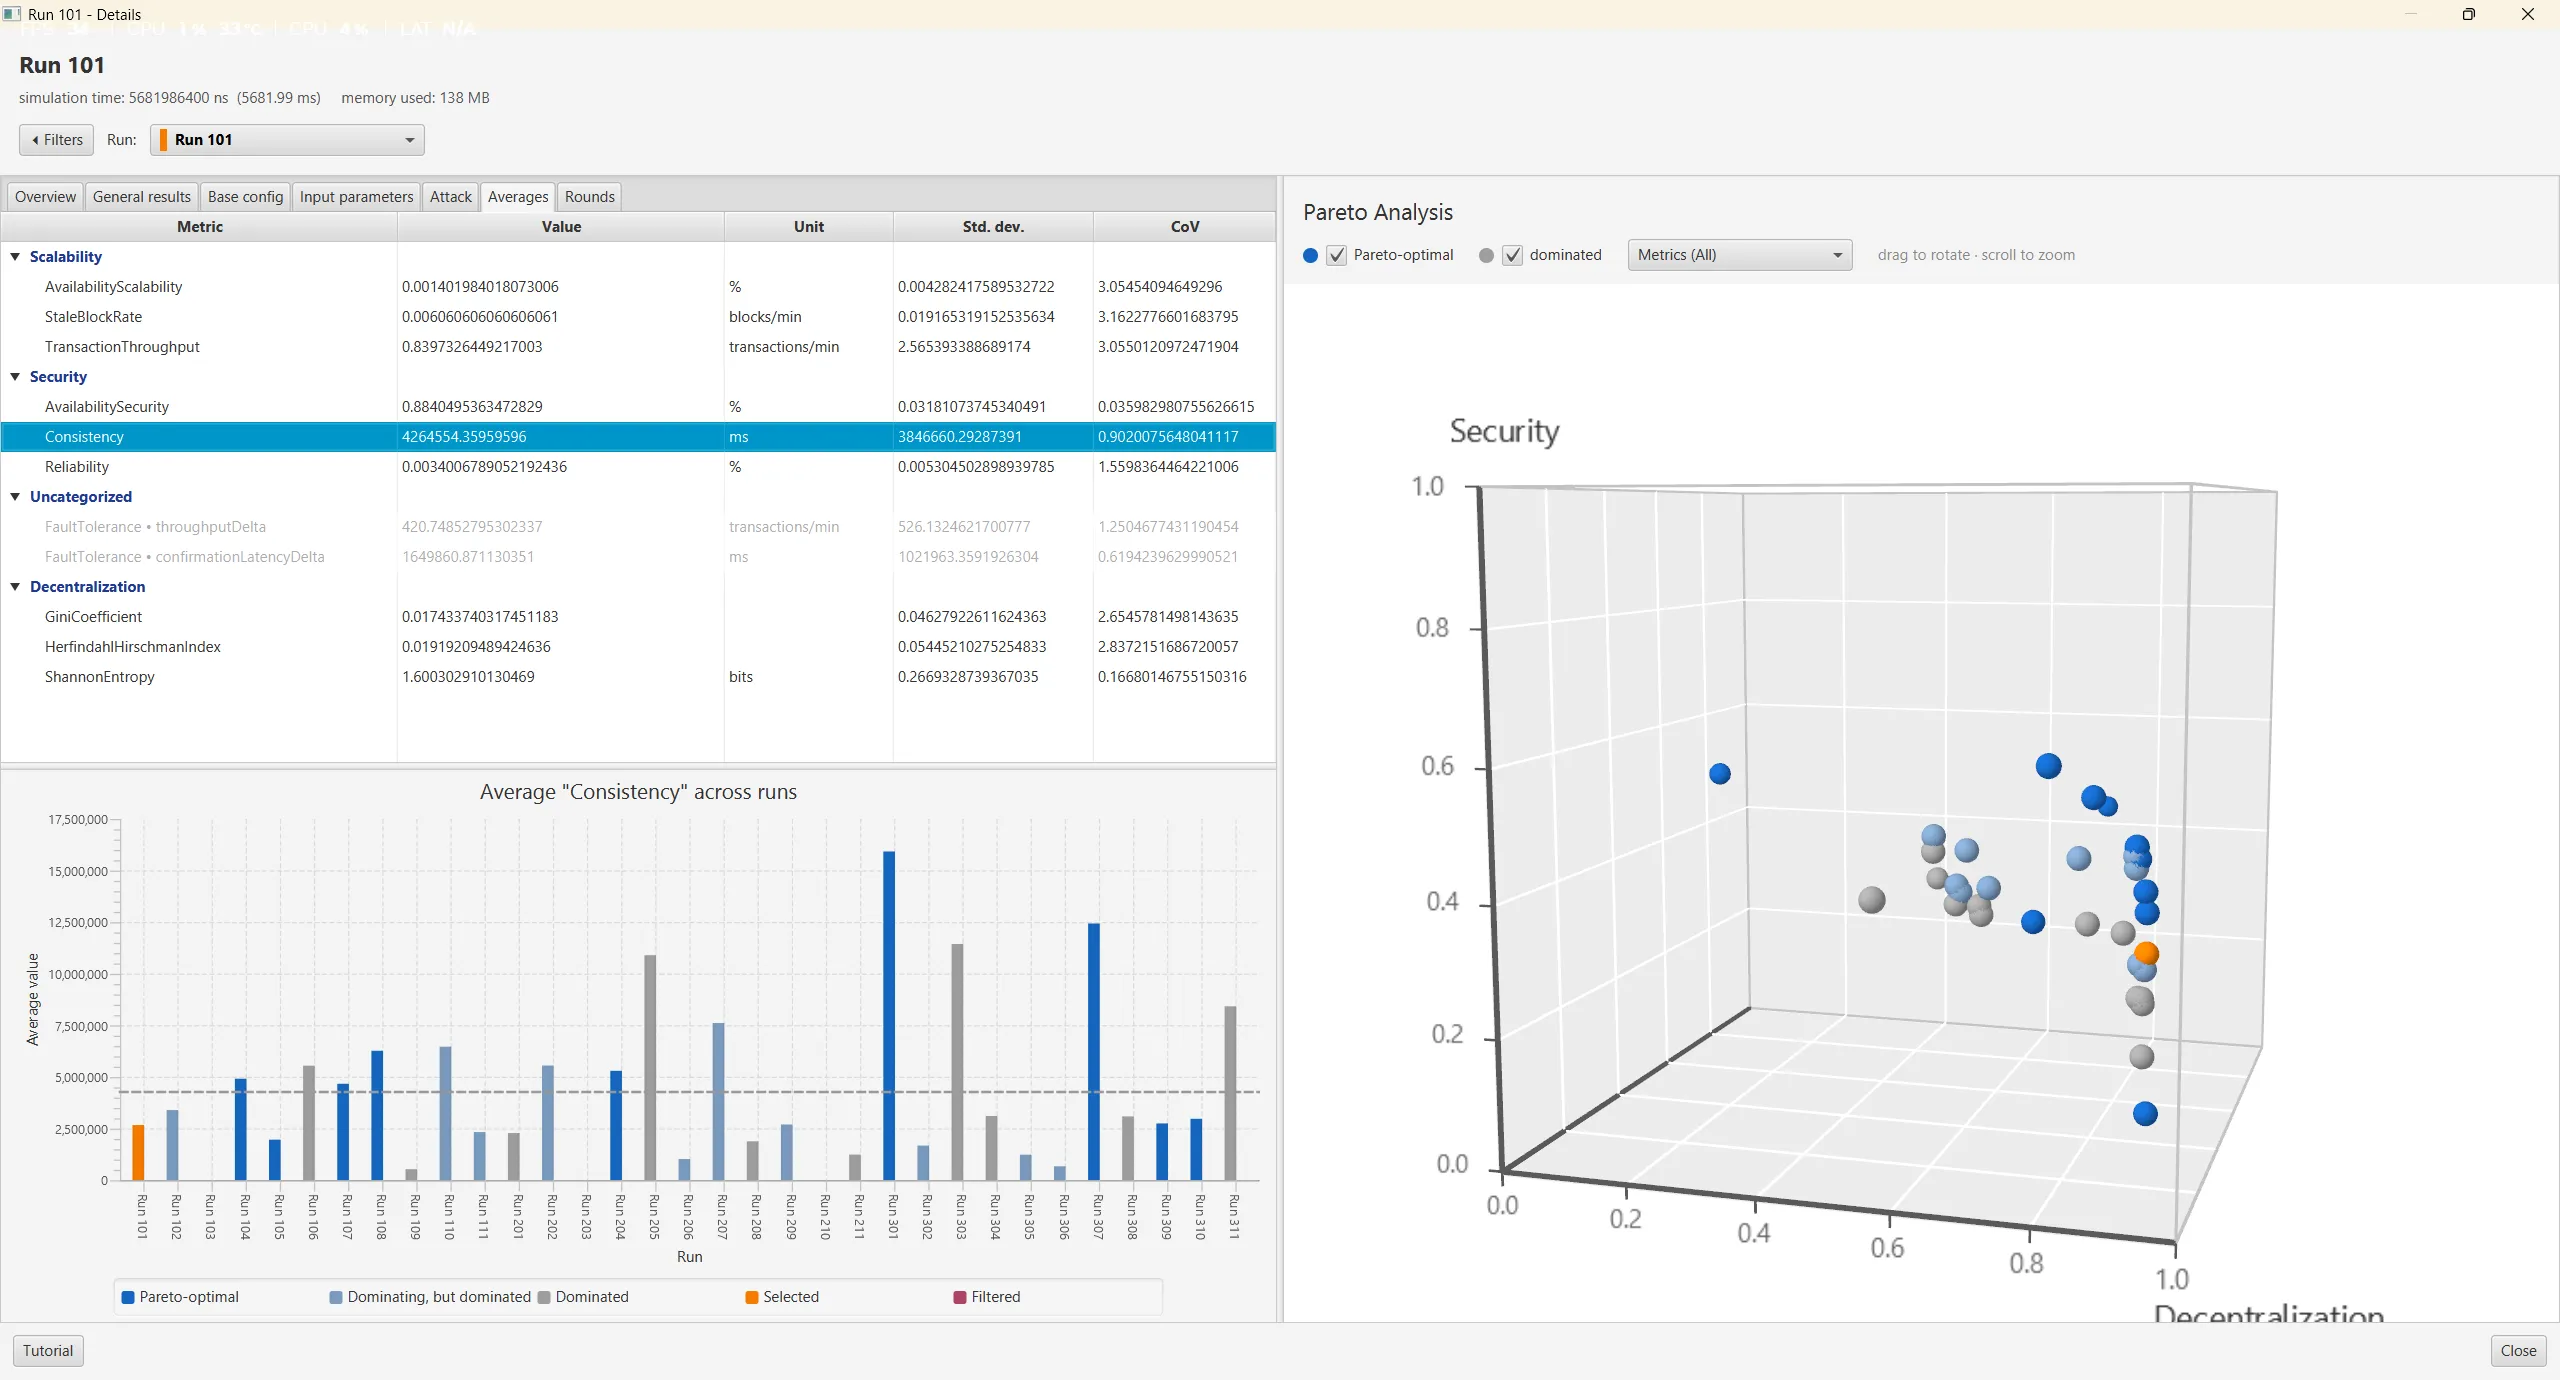
How the points in the cube are computed is described in How the Pareto calculation works.
Additional views
Section titled “Additional views”error_dialog.fxml can be displayed from every scene and is called if an error occurs.